Technical analysis is a popular tool or research method used by those known as technical analysts or chartists to predict the future moves of a stock. Technical analysis claims to be able to provide the information necessary to predict the manner in which a stock will move and when it will reach its peaks and lows.
This allows the chartist to time exactly when to buy and sell, but most importantly sell the stock. Technical analysis and charts are often the investing tools of day traders, not long term investors. However, the youthful investor can be a day trader, long term investor, or both. Adopting both can be most beneficial.
In technical analysis the chartist is not concerned with future earnings, the company profile, or competition which they believe is all inherent in the market and reflected in the chart. Thus they do not spend time analyzing these elements. From this chartists are able to focus their time perhaps more efficiently on studying the patterns of the charts to lock in profits.
To minimize loss they often use stop-loss orders and can go either long or short on a stock holding. These investors look for specific patterns on the chart such as the “ head and shoulders” theme which is said to spell immanent bullish or bearish reversal for the stock.
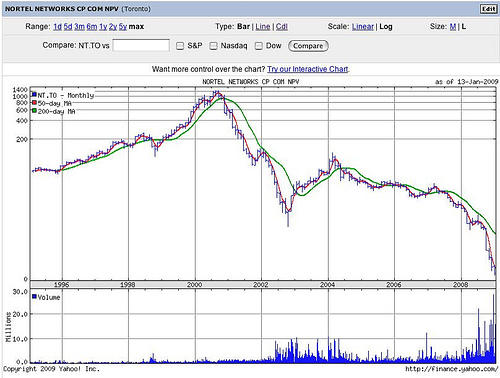
The charts used by technical analysists consist of two main elements – the vertical bars indicating the time period in question, often less than a year and perhaps of that day and how far the bar goes determines the price. The highest is the highest paid price whereas the lowest is the lowest paid price within the given time frame.
This is coupled with right and left side bars indicating opening and closing price respectively. These are known as Open-high-low-close charts or OHLC. They are the most commonly used followed by the candlestick chart and the simple line chart.
In this example the period of time is measured by quarters. Below the horizontal line is a measure of the volume of shares traded. Notice how these spikes correspond with the graph above.
Technical analysis is highly reliant on history and the chartist firmly believes that the history of a stock plays a large role in the direction of the chart. However, that does not mean investors are unanimous on its success. One such doubter is Burton Malkiel, Princeton Economist and author of the book A Random Walk Down Wall Street
He equates technical analysis and the use of charts to witches and magic, citing in his research the lack of credible data to prove the effectiveness of technical analysis.
Other skeptics to technical analysis are those who are proponents of the efficient market hypothesis otherwise known as EMH. These economists and investors state that there is far more evidence to suggest the markets are considerably efficient with little to no data to prove otherwise. They believe that any number of tools are not enough for investors as the market moves. Thus the thesis of technical analysis, that past prices predict future prices, is according to them inherently wrong.
Technical analysis is commonly understood to be a useful tool used in conjunction with other investing strategies but not very often alone. Nevertheless, having a great foundational understanding of the technique can be very beneficial for employment opportunities in investing and finances.
If you are still found asking yourself, “what is technical analysis” and you would like to learn more or seek a professional career, purchase a copy of Technical Analysis of the Financial Markets. John Murphy is the authority for all the big shot investors and market analysts and a necessity on the investors bookshelf.